Data Visualization – Turning Data into Clear Insights
Data Visualization is the practice of presenting raw information in visual formats such as charts, dashboards, and graphs. Instead of scanning endless rows in a spreadsheet, managers and analysts can quickly identify trends and patterns through clear visuals. This process not only saves time but also makes communication across teams far more effective.
Why Data Visualization Matters
In today’s fast-moving business environment, clarity and speed are critical. Data visualization allows organizations to spot trends, track performance, and communicate insights quickly. Moreover, interactive dashboards give decision-makers real-time access to information, helping them respond to changes without delay. For example, a sales dashboard can reveal regional performance while an operations dashboard highlights supply chain issues.
Types of Visual Analytics
Companies use different approaches depending on their needs:
Charts and Graphs: simple but powerful ways to highlight patterns.
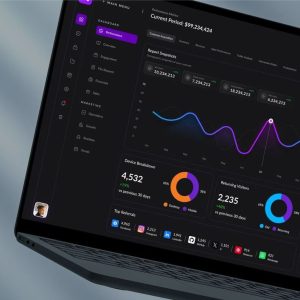
Dashboards: collections of KPIs and metrics in one place.
Maps: geospatial data for location-based insights.
Interactive Tools: allow users to filter, drill down, and compare results.
In addition, advanced platforms now combine visualization with predictive analytics, enabling smarter business decisions.
Future Trends in Data Presentation
The future of visual analytics will be driven by artificial intelligence and automation. AI-powered dashboards will recommend actions based on live data, while augmented analytics will allow teams to use natural language queries to explore information. Furthermore, immersive technologies such as AR and VR will provide new ways to interact with complex datasets, making insights more engaging and accessible.
Challenges in Data Visualization
While highly valuable, data visuals also present challenges. For example, poor data quality can result in misleading conclusions. On the other hand, overly complex dashboards may overwhelm users. Therefore, organizations must ensure that data presentation strikes a balance between simplicity and depth, delivering insights that are accurate, ethical, and easy to interpret.
Conclusion
In conclusion, Data Visualization is not just about making data look attractive—it is about making it understandable and actionable. By adopting modern visualization tools, businesses improve decision-making, empower teams, and gain a competitive advantage in the data-driven economy.